Learning Resources
Articles
- Observability with OpenTelemetry is a great learning series by Thomas Stringer in 5 parts, covering Introduction, Instrumentation, Exporting, Collector, Propagation, Ecosystem.
- Prometheus vs. OpenTelemetry Metrics: A Complete Guide
Newsletters
Make sure to subscribe and also learn more in their online archive.
Workshops
Learning eBPF for better Observability at Cloudland 2023
For Cloudland 2023, Michael Friedrich created a new workshop "Learning eBPF for better Observability" with new exercises. Thanks to Liz Rice's great book "Learning eBPF", the workshop added more challenges to the exercises. The workshop project provides a Lima VM (macOS), Vagrant environment, or standalone Ansible role to provision a Ubuntu 23 VM with the required build tools and git clones. The slides guide you through the workshop environment, and is structured into the following learning path way:
- eBPF first steps (Learning strategy, bcc: trace evecve, bcc discussion, bpftrace, bpftrace: open calls, bpftrace use cases)
- eBPF development (languages, architecture, CO-RE, eBPF Verifier, Kernel code: count packets with XDP, maps, load kernel programs)
- Development libraries (XDP with Go, XDP with Rust)
- eBPF for Observability (eBPF exporter for Prometheus, Prometheus metrics, OpenTelemetry, Profiling, Kubernetes with Coroot)
- Additional content: eBPF for SRE&DevOps, eBPF for Security, eBPF for Everyone; Automation, CI/CD, DevSecOps
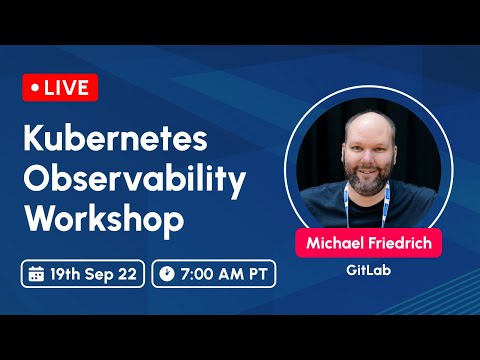
Kubernetes Observability workshop for Kube Simplify
Michael Friedrich provides a 3.5 hours live workshop on Kubernetes Observability for the Kube Simplify workshop series as a free learning resource. After an introduction, the workshop starts with an overview of monitoring, metrics with Prometheus, and how to build and use dashboards in Kubernetes. Alerts, incidents and SLOs are practiced by example, building the bridge into more Observability data with tracing, logs and more event types. Chaos engineering is practiced with Chaos Mesh to trigger alerts when DNS errors force an app to leak memory. This allows users to practice the KubeCon EU 2022 demo themselves. Scaling, long term storage, security workflows as well as new innovative ideas with OpenTelemetry and eBPF are discussed too. The workshop includes exercises and solutions ready for production environments afterwards.
Resources:
Recording:
Table of Content, added to the recording:
1:38 Introduction with Saiyam and Michael
8:10 Workshop Start
8:58 What to expect
10:05 Workshop requirements
12:22 Tips
15:06 Monitoring, quo vadis - in a nutshell, black-box, metrics/trends, microservices, whitebox
23:00 Kubernetes - learn what to monitor
29:45 Metrics with Prometheus - Architecture, PromQL, UI,
39:15 Prometheus Operator - install Prometheus in Kubernetes
52:22 Kubernetes Metrics
54:45 Prometheus Metrics in Grafana - Dashboards inspection, deployed by Prometheus Operator
1:02:56 Workshop dashboards in Grafana - first panel and Kubernetes dashboard, container metrics, kube-state-metrics,
1:21:34 ServiceMonitor CRD for /metrics endpoints auto discovery with Prometheus
1:37:56 Monitoring 2.0 - Prometheus client libraries & instrumentation,
1:45:43 Alerts and SLOs - Prometheus Operator CRDs, Alert Manager, podtato-head
1:55:53 Trigger alerts for podtato-head deployment - blackbox probe, dashboards, alert rules,
2:14:45 Service Level Objectives & Ops Confidence  - Golden Signals, SLOs as code,
2:19:15 Customize kube-prometheus - custom dashboards, reduce visible data, see what is important
2:22:50 Beyond Metrics - Logs, Tracing, OpenTelemetry
2:31:28 OpenTelemetry demo deployment  - shop, website, Jaeger tracing,
2:39:05 Discussion: Why traces? What's next
2:45:35 Performance and Scaling  - data retention, long-term storage,  distributed scaling, GitLab.com SaaS production insights,
2:53:50 Observability and Chaos Engineering
2:56:06 Chaos Mesh
2:58:10 DNS Chaos - demo exercise from KubeCon EU, leak app memory, verify alerts and SLOs
3:12:45 Take action from chaos experiments
3:15:00 Future Observability - eBPF, auto-instrumentation with Cilium Tetragon, etc.
3:17:30 SLOs and quality gates with Keptn
3:17:48 Security - Policies with Kyverno, Hardening (book recommendation: Hacking Kubernetes)
3:18:54 Your adventure -
3:19:20 Q&A - https://o11y.love and outro with Saiyam and Michael
Practical Kubernetes Monitoring with Prometheus
The slides provide a 4+ hours workshop, more details are available on Michael Friedrich's personal blog. The following topics will be practiced:
- Monitoring, quo vadis puts the traditional monitoring in contrast to microservices.
- Prometheus and Grafana shares the basic knowledge on Prometheus, PromQL, Service Discovery and terminology required to understand.
- Kubernetes dives into understanding what to monitor, and how.
- Prometheus Operator dives into the concept of the package, and kube-prometheus installing a full stack. You'll dive into the UI of Prometheus, Grafana and the Alert Manager.
- K8s monitoring with Prometheus walks you through the - amazing - default Grafana dashboards, instructs you to deploy a Go demo app with the CRD ServiceMonitor, Container Metrics and kube-state-metrics exercises to practice PromQL queries.
- Advanced Monitoring practices with a Python app and own metrics, deployed to the GitLab container registry and to Kubernetes to query with PromQL in Grafana dashboards. Storage with Thanos/Cortex, Service Discovery is touched as well.
- Alerts and Escalations dives into the Alert Manager and rules, mapped into the PrometheusRule CRD.
- SLA, SLO, SLI keeps you busy with learning about Service Level Objectives for your production environment, providing thoughts on CI/CD quality gates with Keptn - and the OpenSLO spec, Pyrra and Sloth.
- Observability moves from Monitoring to metrics, logs, traces and beyond.
- Secure Monitoring discusses TLS, secret management, Infrastructure as code workflows, Container security and RBAC & policies.
- Ideas on more monitoring with Prometheus exporters, podtato-head, Chaos Engineering, etc.
A shorter version of the workshop as a talk was provided by Michael Friedrich at PromCon NA 2021, a zero day event at KubeCon NA.
Talks
Past talks:
- Chaos Carnival 2022: From Monitoring to Observability: Left Shift your SLOs with Chaos
- All Day DevOps 2021: From Monitoring to Observability: Left Shift your SLOs
- All Day DevOps 2020: From Monitoring to Observability: Migration Challenges from Blackbox to Whitebox
Meetups
- SLOconf Monthly, former SRE meetup.
- #EveryoneCanContribute cafe meetup
- 54. #EveryoneCanContribute Cafe: Pixie for Kubernetes Observability
- 52. #EveryoneCanContribute Cafe: Learned at KubeCon EU, feat. Cilium Tetragon first try
- 47. cafe: Observability, quo vadis
- 32. cafe: Continuous Profiling with Polar Signals
- 30. cafe: Kubernetes Monitoring with Prometheus
- 25. cafe: Observability with Opstrace
- 7. cafe: Docker Hub Rate Limit: Mitigation, Caching and Monitoring
- 6. cafe: Grafana Tempo
- 1. cafe: QuestDB
Trainings
There are many ways to learn, and also define Observability. This list is not exhaustive, a recommendation by individuals who have taken the trainings is preferred prior to adding a new entry.
| Training | Vendor | Topics | Recommended by |
|---|---|---|---|
| Prometheus Trainings | PromLabs | Prometheus, App instrumentation, Kubernetes | @dnsmichi |
